

Greenhouse Gases Emission Reporting 2025 for Universiti Malaya
Universiti Malaya (UM) remains resolute in its institutional commitment towards the aspiration of carbon neutral campus by 2030 and Net Zero emissions by 2050, underpinned by a whole-of-university transformation approach that integrates decarbonisation, operational excellence, and climate accountability across governance, teaching, research, and campus operations.
On 11 December 2024, UM Management formally endorsed the Universiti Malaya Net Zero Blueprint 2030, establishing a structured pathway towards a low-carbon and climate-resilient campus. Building on this foundation, the Blueprint has since been refined and strengthened from six (6) to eight (8) strategic sectors based on the refinement exercise conducted in 2025, reflecting a more comprehensive, systems-based approach led by the Eco Campus Division, Sustainable Development Centre (UMSDC), with oversight from the UM Eco Campus Steering Committee and active mobilisation of key university stakeholders.
The eight (8) priority sectors are:
Sector 1: Energy
Sector 2: Mobility
Sector 3: Waste Minimisation & Recycling
Sector 4: Value Chain
Sector 5: Beyond Campus Operations
Sector 6: Water
Sector 7: Green Building
Sector 8: Biodiversity
This expanded framework reflects UM’s transition from operational carbon management to a holistic ecosystem approach, integrating nature-based solutions, sustainable infrastructure, responsible procurement, and extended impact beyond campus boundaries.
In 2025, the Universiti Malaya Strategic Plan 2026–2030 was officially endorsed, featuring a dedicated thrust on an Environmental, Social and Governance (ESG)-driven ecosystem. Notably, carbon neutrality has been elevated as one of the University’s twelve flagship projects, underscoring UM’s institutional commitment to advancing a low-carbon, resilient, and sustainable campus.
UM’s Greenhouse Gas (GHG) accounting, initiated in 2022 as the baseline year, currently covers Scope 1 and Scope 2 emissions, forming the foundation for data-driven decision-making, performance tracking, and continuous improvement through the current development of comprehensive sustainability dashboard.
Moving forward, UM is committed to deepening its emissions inventory, strengthening real-time monitoring systems, and embedding ESG-driven performance indicators, ensuring alignment with global frameworks, sustainability rankings, and national climate aspirations.
GHG Emission Reporting 2025 for Universiti Malaya
Scope 1 Emission
The study calculated UM’s scope 1 emission for the year 2025. The total emissions for Scope 1 Emission were calculated based on the following equation:
Emissions (kgCO2e) = Quantity of Fuel Consumed (L or kg) × Emission Factor (kgCO2e per L or kg)
The emission factor used for calculating fuel combustion for both diesel and petrol are as follows:
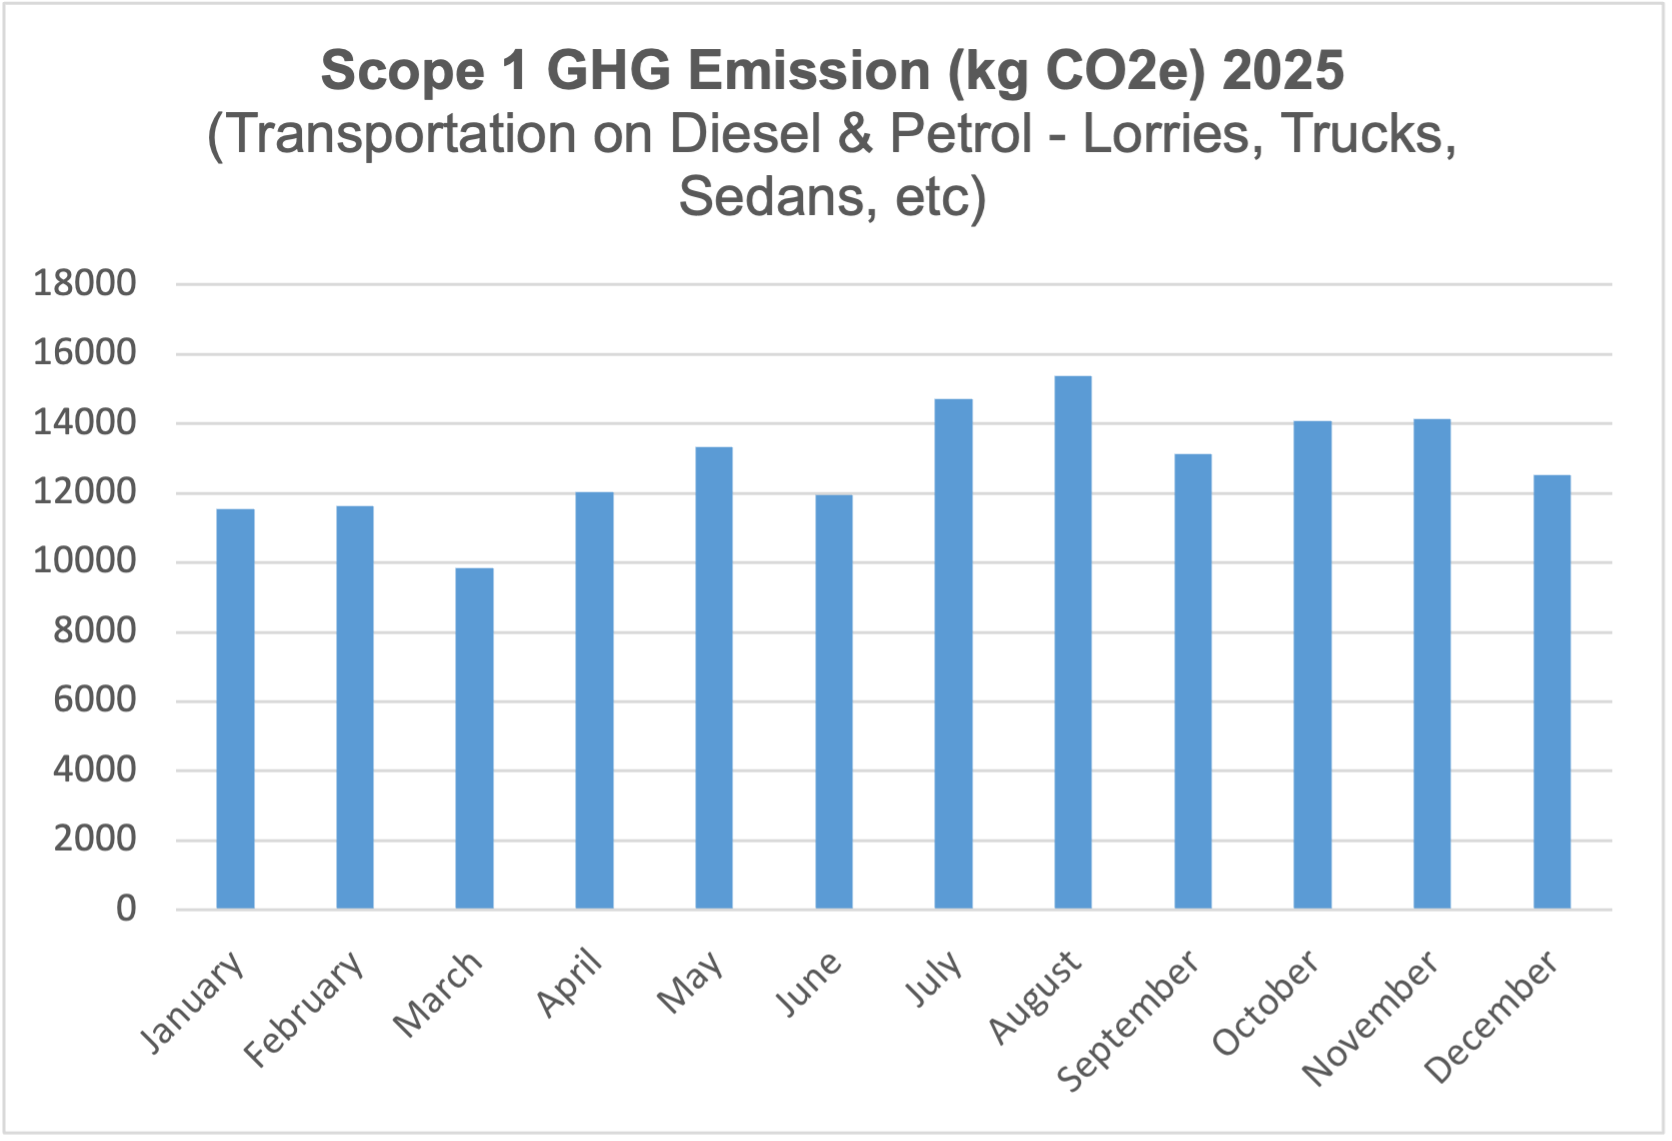
Figure 1: Total estimated GHG emission from scope 1 emission in 2025
(Lorry, Van, Sedan, etc) by Diesel & Petrol
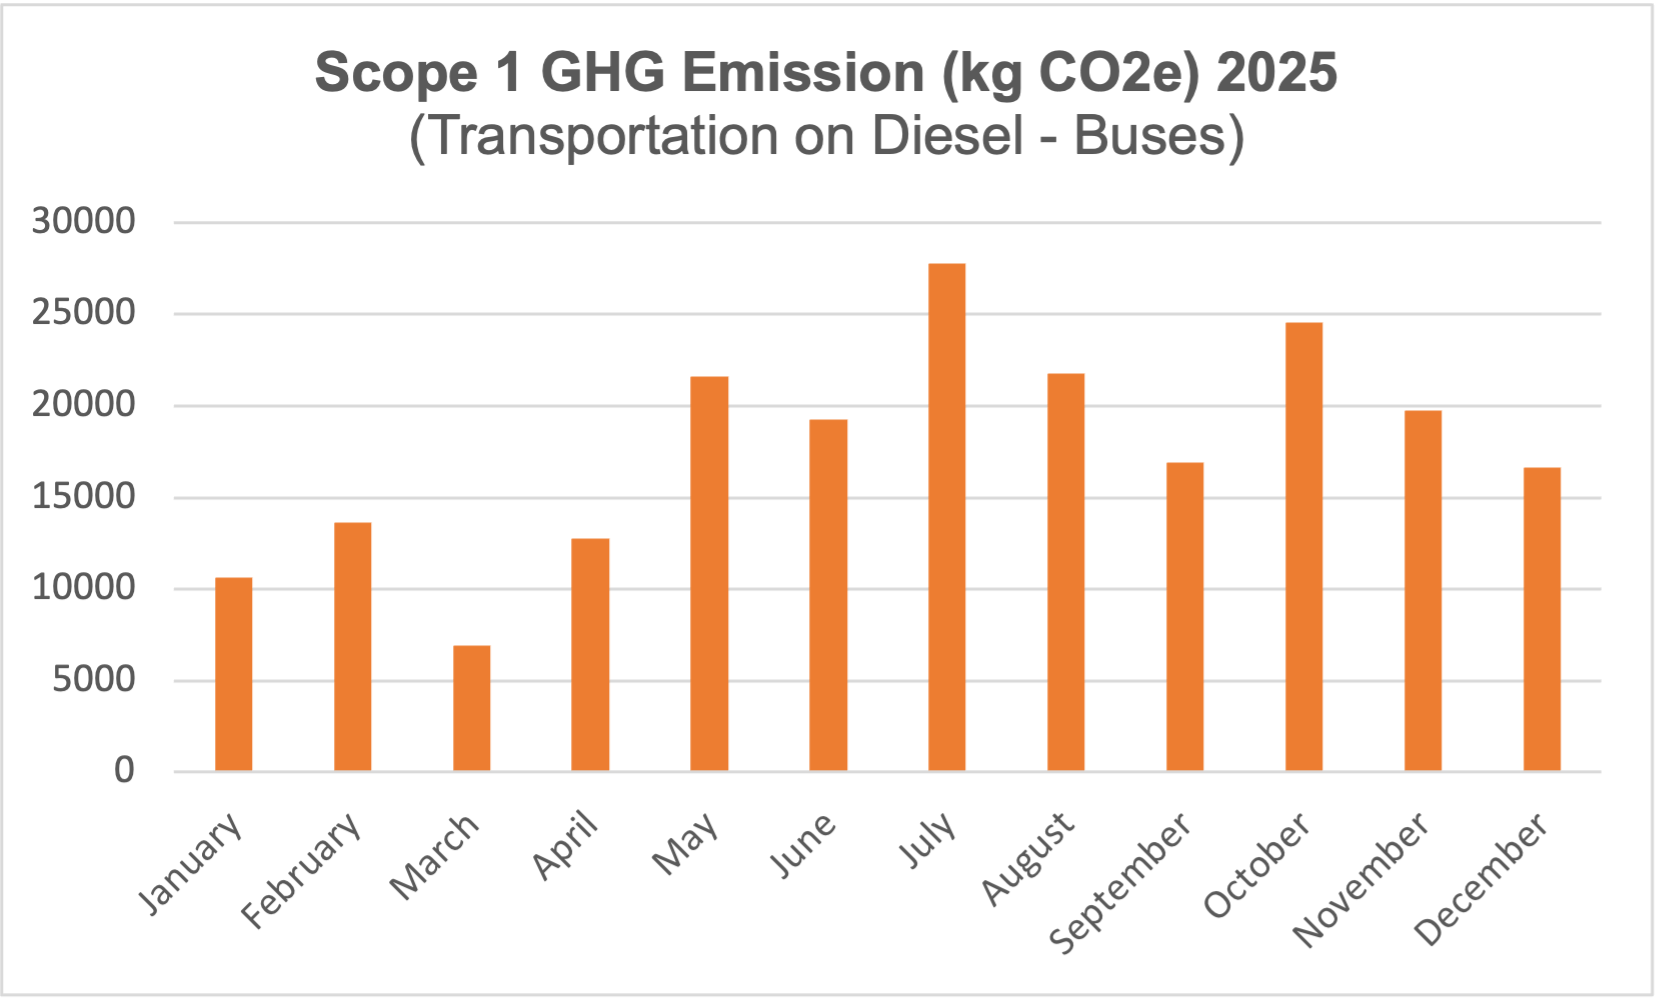
Figure 2: Total estimated GHG emission from scope 1 emission in 2025
(Zone 2: Buses) by Diesel
Overall GHG Emission: 366,490.671 kgCO2e (366.490 t CO2e) Thus, the total scope 1 emission from fuel use in 2025 covering 2 zones as managed by the Estates Department (JHB) for Universiti Malaya are as follows:
Lorry, trucks, sedans, etc.: 154,279.146 kgCO2e
Buses: 212,211.525 kgCO2e
Overall GHG emission = 366,490.671 kgCO2e
Figure 1 and 2 represents the monthly GHG emission throughout 2025 for both petrol and diesel consumption by vehicles owned and managed by JHB for UM. In comparison to the year 2024 [315,991.55 kg CO2e (315.99155 t CO2e)], there has been an increase of emissions of 16% from fuel use for Universiti Malaya. This may be attributed to the increase of campus activities throughout the university and an increase of campus population.
Fugitive Emissions from Air Conditioning Systems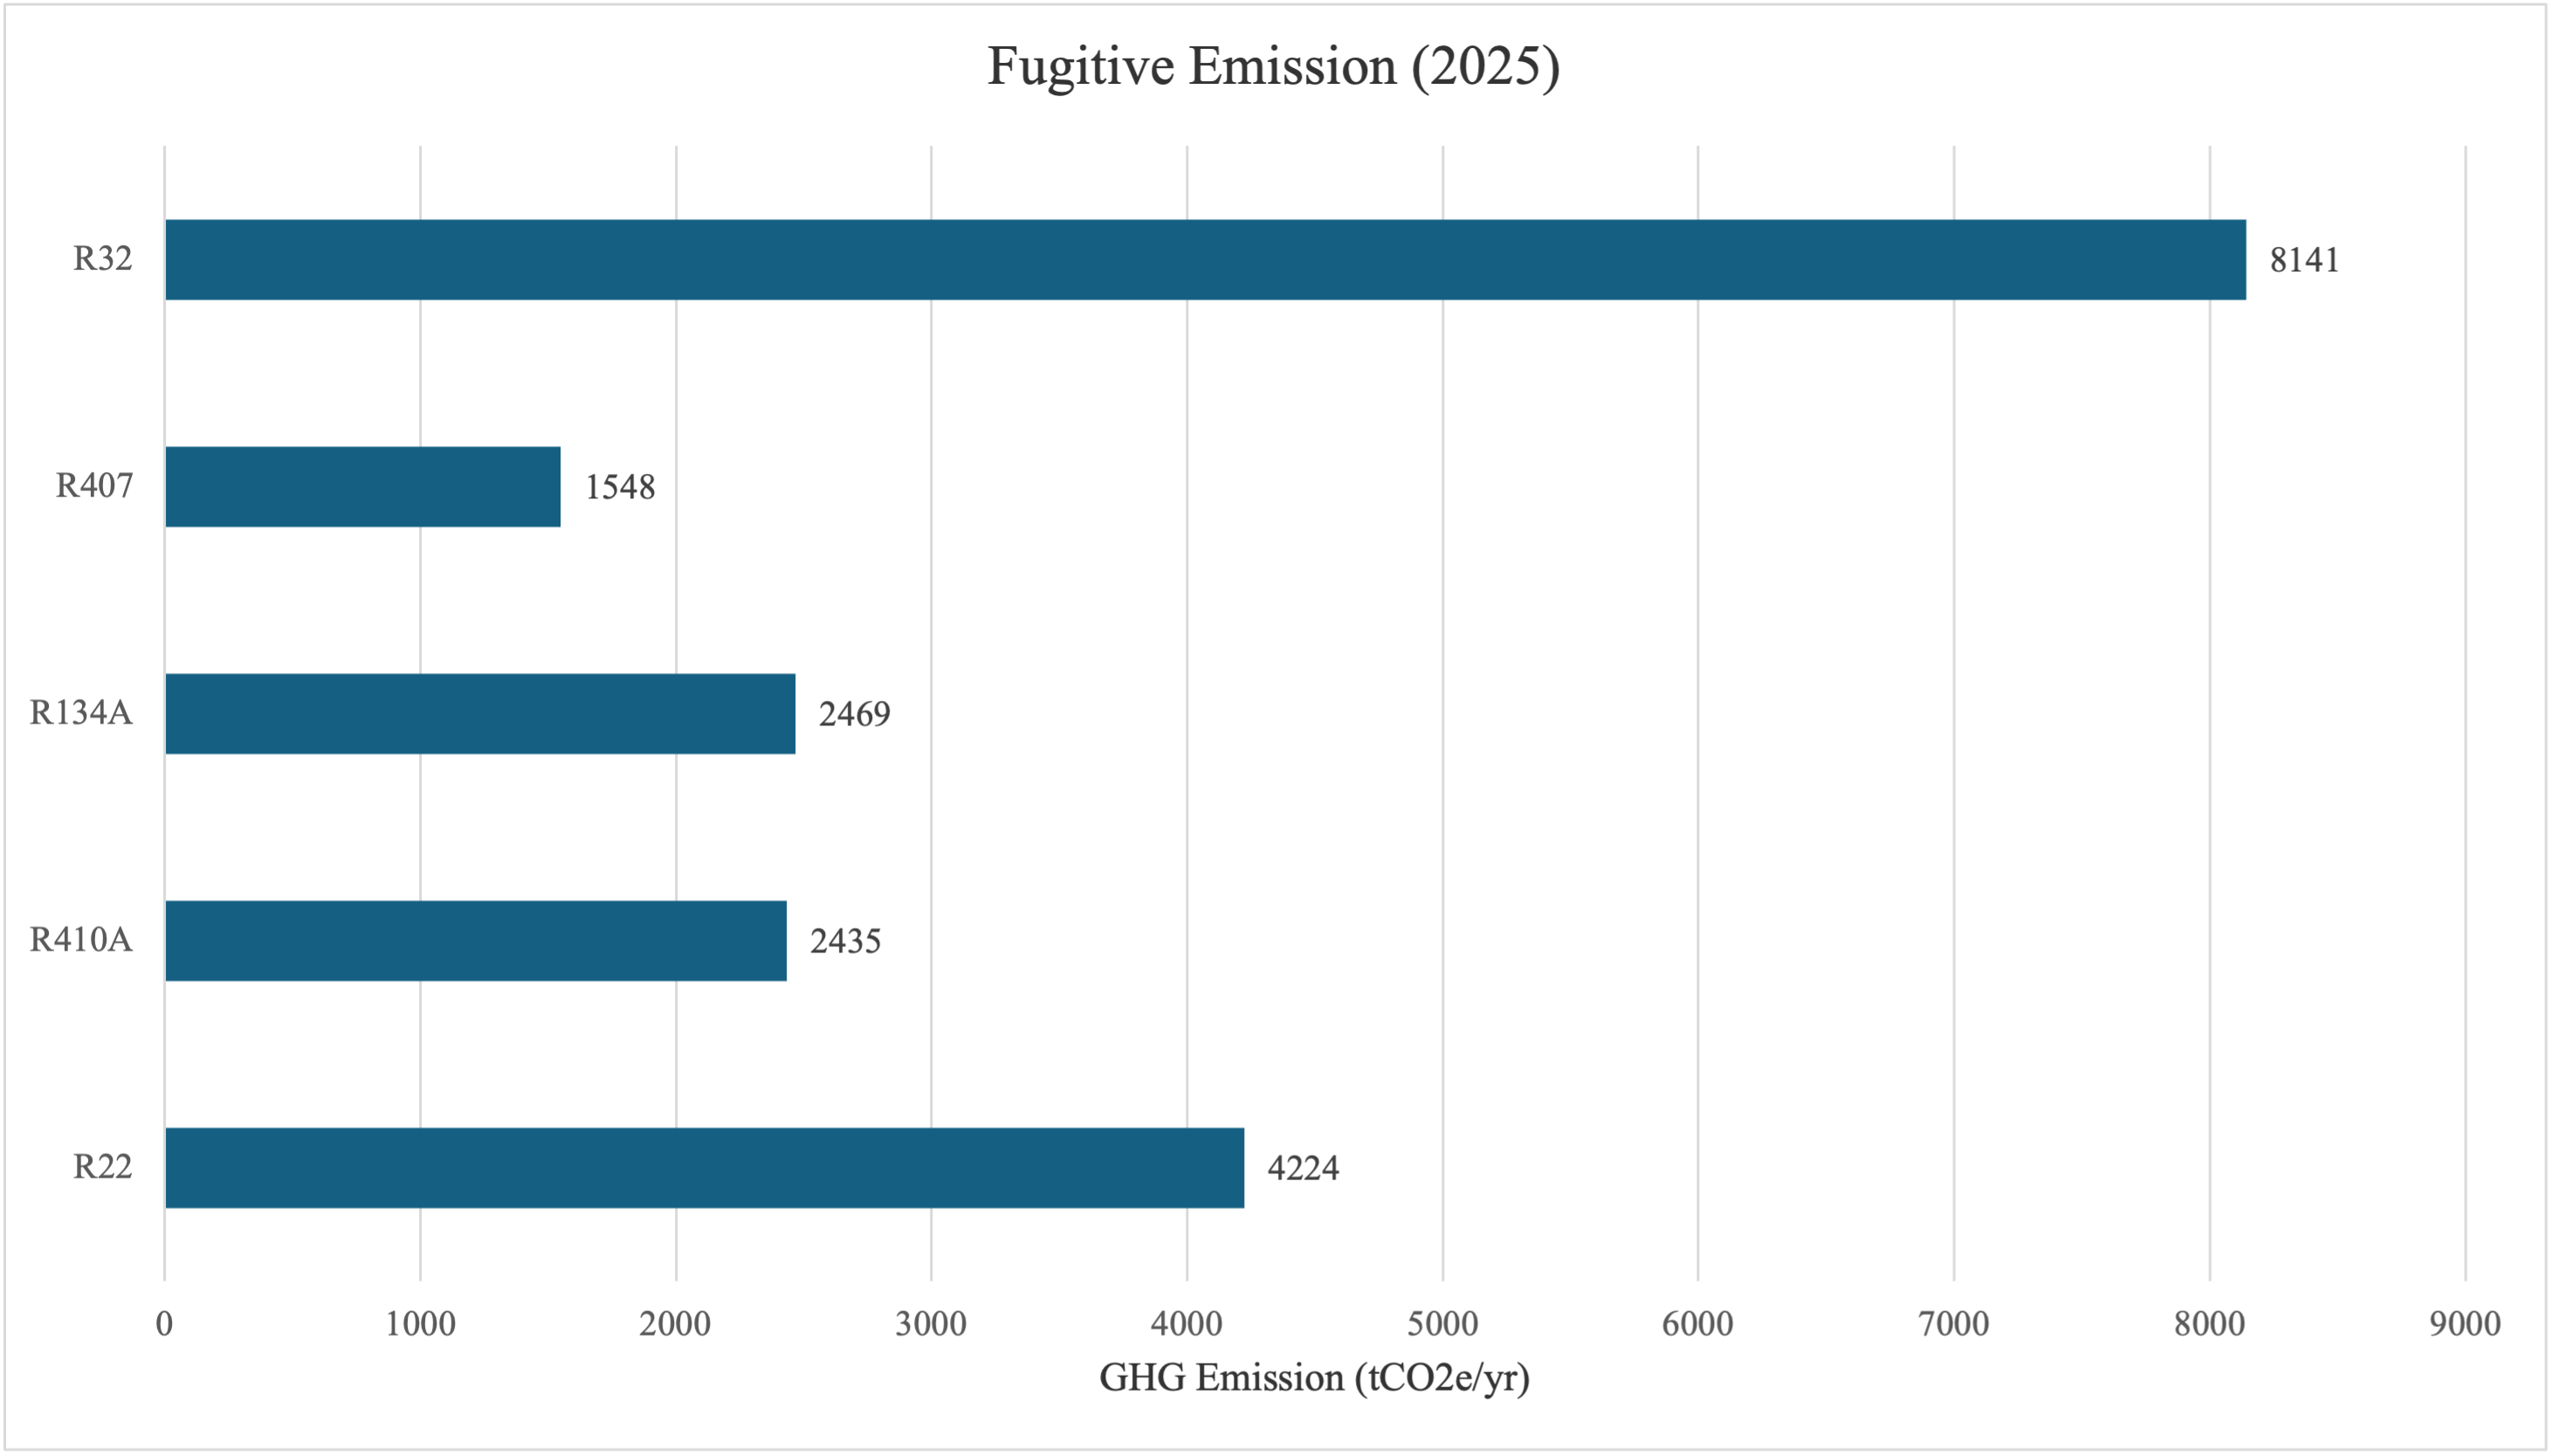
Figure 3: GHG emission from fugitive emission in 2025
Fugitive emissions were included in the 2025 inventory using a screening method, which is a simplified estimation approach based on default emission factors and general assumptions from the GHG Protocol. This method is typically applied when detailed asset-level data is unavailable and is intended to provide an indicative estimate rather than precise quantification. The inclusion improves the completeness of Scope 1 reporting, but the values should be interpreted as preliminary and subject to refinement in future assessments.
The emissions were quantified using GHG Protocol’s Calculator for Refrigerant, a widely recognised tool for estimating emissions from refrigerant losses. The calculation considers the type of refrigerant used and the estimated leakage rates from our cooling equipment across campus. Based on this approach, the total estimated emission from leaked refrigerants from all air conditioning systems is around 18,814 tCO2e.
The chart above summarizes emissions by refrigerant type used in our air conditioning systems:
R32 is the largest contributor, with approximately 8,141 tCO₂e/year, accounting for the majority of fugitive emissions.
R22, an older refrigerant being phased out globally, contributes 4,224 tCO₂e/year.
R134a and R410A contribute 2,469 and 2,435 tCO₂e/year, respectively.
R407C shows the lowest emissions at 1,548 tCO₂e/year.
These findings highlight that refrigerant leakage is a significant source of emissions for UM, especially from systems using R32 and R22. While some of these refrigerants are more energy-efficient, their environmental impact when leaked can be substantial.
The relatively high emissions from R22 are particularly important, as this refrigerant is being phased out internationally due to both environmental and regulatory reasons. Its continued presence indicates opportunities for system upgrades and UM is intending to phase out the refrigerant.
With the inclusion of fugitive emissions into this year’s Scope 1 calculation, we are reporting a significant increase in emission where:
Fuel consumption emission: 366.490 t CO2e
Fugitive emission: 18,814 tCO2e
Overall Scope 1 Emission = 19,180.49 tCO2e
Scope 2 Emission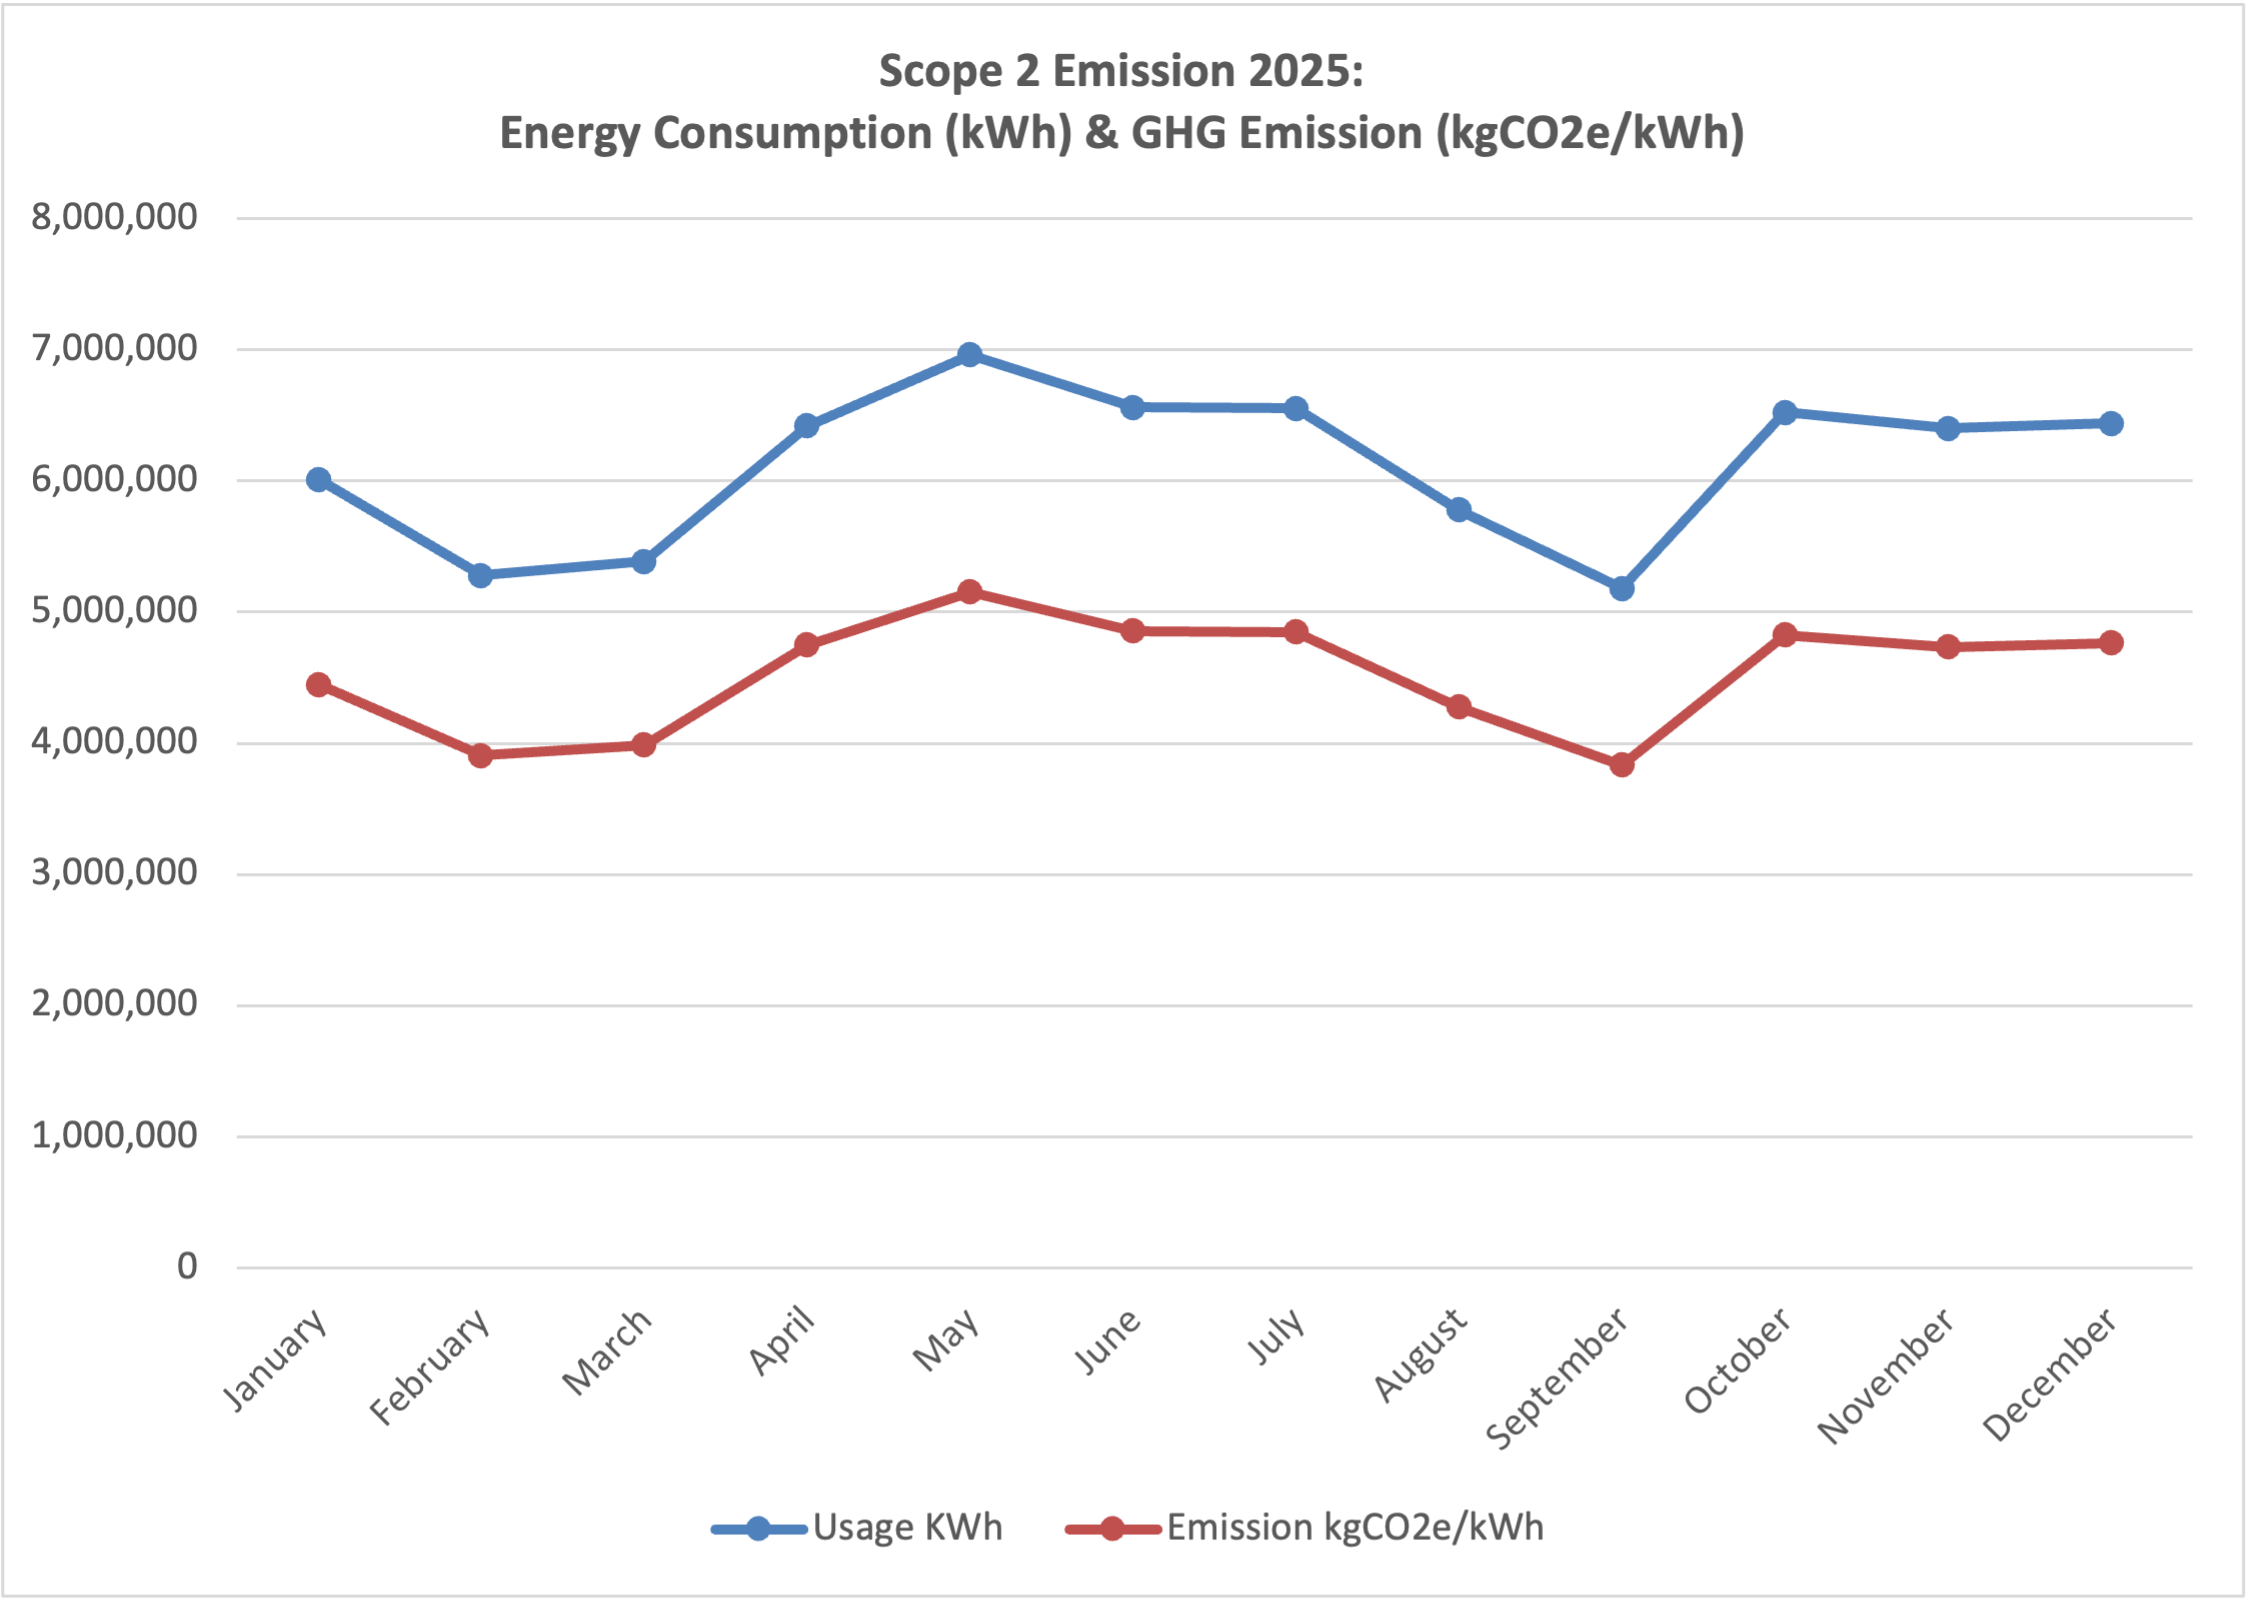
Figure 4: Monthly GHG emission from Scope 2 in 2025
The scope 2 emissions were calculated using data obtained from 2025. The total emissions for Scope 2 were calculated based on the following equation:
Emissions (kgCO2e) = Total kWh Consumed × Emission Factor (kgCO2e per kWh)
Calculation:
Emissions (kgCO2e) = 73,490,477 kWh x 0.740 kgCO2e/kwh
= 54,382,952.98 kgCO2e.
The emission factor used for calculating energy emissions is 0.740 kgCO2e/kwh (0.000740 tCO2e) from the Energy Commission in 2024.
The total calculated GHG emission for scope 2 in 2025 is 54,382,952.98 kgCO2e (54,382.952 tCO2e) (in comparison to 56,749,060.93 kg CO2e (56,749.061 tCO2e) for 2024]. Figure 5 represents the monthly GHG emission coming from scope 2, with a reduction of 4.17% from the year 2024. The reduction in Scope 2 emission may be attributed to the lower emission factor published by the Energy Commission in February 2026 and reduced electricity usage despite increase in campus population.
Figure 5: Monthly GHG emission for Scope 2 in 2025
Total Scope 1 & Scope 2 Emission for UM in 2025: 19,180.49 t CO2e + 54,382.952 t CO2e = 73,563.412 t CO2e
Universiti Malaya recorded a significant increase in total greenhouse gas (GHG) emissions in 2025, rising by 29% compared to 2024 levels from 57,065.05 tCO₂e to 73,563.41 tCO₂e. This increase is primarily attributed to the inclusion of Scope 1 emission from fugitive emission coming from air conditioning systems throughout the university.
It is important to note that this increase reflects an improvement in the completeness and transparency of emissions reporting, rather than solely an operational rise in emissions. The expanded reporting boundary allows for more accurate tracking of the university’s carbon footprint and supports better-informed decision-making in future sustainability initiatives.
Disclaimer: This Greenhouse Gas (GHG) Inventory for Universiti Malaya (UM) for the 2025 reporting period is prepared in accordance with the GHG Protocol Corporate Standard, focusing on Scope 1 (Direct Emissions) and Scope 2 (Indirect Emissions from Purchased Electricity).
At this stage, Scope 3 emissions (Value Chain emissions) have been excluded from the total carbon footprint calculation due to data collection complexities and the need for standardized reporting across the diverse university ecosystem. It is important to note that for large-scale higher learning institutions, Scope 3 typically represents the most significant portion of the total environmental impact.
Benchmarks from peer institutions, such as Monash University (where Scope 3 accounts for approximately 64%–70% of total emissions) and the University of Surrey (reporting up to 81%), suggest that UM’s total carbon footprint would likely increase by 3 to 4 times if Scope 3 categories specifically student/staff commuting, international business travel, and procurement were fully accounted for.
UM remains committed to expanding its reporting boundary in future cycles to include material Scope 3 categories as data transparency within our supply chain and community improves.
Acknowledgement: The GHG Emissions 2025 for UM is prepared by Sustainable Development Centre (UMSDC) with support of the Estates Department (JHB), Corporate Rankings Centre (CRC) and UM Living Lab Projects (Net Zero and Environmental, Social and Governance / ESG@UM).
References
Energy Commission (EC). (2026). Grid Emission Factor (GEF) in Malaysia. Malaysia Energy Information Hub. https://myenergystats.st.gov.my/documents/d/guest/grid-emission-factor-gef-in-malaysia-2022-2024-provisional-;
Monash University. (n.d.). Sustainable development. https://www.monash.edu/about/strategic-direction/sustainable-development
Strategy. Sustainability policies | University of Surrey. (n.d.). https://www.surrey.ac.uk/sustainability/about/strategy
UK Department for Energy Security and Net Zero. (2023). Greenhouse Gas Reporting: Conversion Factors 2023. UK Department for Energy Security and Net Zero. https://www.gov.uk/government/publications/greenhouse-gas-reporting-conversion-factors-2023
United States Environmental Protection Agency (USEPA). (2023). Scope 1 and Scope 2 Inventory Guidance. United States Environmental Protection Agency (USEPA). https://www.epa.gov/climateleadership/scope-1-and-scope-2-inventory-guidance
United States Environmental Protection Agency. (2023). Greenhouse Gas Reporting Program (GHGRP). United States Environmental Protection Agency. https://www.epa.gov/ghgreporting/learn-about-greenhouse-gas-reporting-program-ghgrp
Universiti Malaya Sustainable Development Centre (UMSDC). (2022). UM In Low Carbon Cities Framework (LCCF). Universiti Malaya Sustainable Development Centre (UMSDC). https://sustainability.um.edu.my/um-in-low-carbon-cities-framework-lccf
Universiti Malaya Sustainable Development Centre (UMSDC). (2025). UM Net Zero Blueprint 2030. Universiti Malaya Sustainable Development Centre (UMSDC). https://sustainability.um.edu.my/doc/Sustainability%20UM/Sustainability%20Reporting/Universiti%20Malaya%20Net%20Zero%20Blueprint_Draft%20Version_compressed.pdf
World Resources Institute & World Business Council for Sustainable Development. (2004). The Greenhouse Gas Protocol: A Corporate Accounting and Reporting Standard (Revised Edition). GHG Protocol.
https://ghgprotocol.org/corporate-standard
Contributors:
1. Assoc. Prof. Dr. Zeeda Fatimah Mohamad - Director, UMSDC (zeeda21@um.edu.my)
2. Dr. Tan Chia Kwang - Head, Eco Campus Division, UMSDC (cktan@um.edu.my)
3. Ts. Dr. Fong Chng Saun - Head, Sustainability Transformation Division, UMSDC (fongcs92@um.edu.my) - Main author
4. Mr. Muhammad Faris Ali - Energy and Carbon Manager, UMSDC (faris_ali@um.edu.my)
5. Mr. Affan Nasaruddin - Research Officer, UMSDC (affannasaruddin@um.edu.my)
6. Mr. Mohd Fadhli Rahmat Fakri - Research Officer, UMSDC (fadhli@um.edu.my)
7. Mr. Muhammad Daniel Md. Lazim - Research Assistant, UM Living Labs, UMSDC (daniellazim@um.edu.my) - Co-author
Last Update: 07/04/2026